Closed
Bug 1007565
Opened 10 years ago
Closed 9 years ago
Large data URI sourcemaps can cause the debugger to hang
Categories
(DevTools :: Debugger, defect)
Tracking
(Not tracked)
RESOLVED
WORKSFORME
People
(Reporter: mwrbrennan, Unassigned)
References
(Blocks 1 open bug)
Details
Attachments
(4 files)
User Agent: Mozilla/5.0 (Macintosh; Intel Mac OS X 10_9_2) AppleWebKit/537.36 (KHTML, like Gecko) Chrome/34.0.1847.131 Safari/537.36

Steps to reproduce:

1. Create a bundled file with e.g. Browserify consisting of >100 files around 10k in size
2. Have Browserify output a source map as a Base64-encoded Data URI
3. Source the bundle, and open the page in the debugger with "Show Original Sources" enabled
4. Observe that opening the debugger after page load the original sources are loaded within a second or two
5. With Debugger still open, reload the page


Actual results:

The browser hangs for upwards of thirty seconds.


Expected results:

Source map is loaded quickly as with opening the debugger after load.
Updated•10 years ago
|
Component: Untriaged → Developer Tools: Debugger
Comment 1•10 years ago
|
||
Interesting. When following the STR, I get an error saying that main.js is not in the source map. Not sure if this is a bug with our debugger or browserify.
| Reporter | ||
Comment 2•10 years ago
|
||
That's odd. What's your main.js? Mine's along the lines of require('1.js'); ...snip 98 lines... require('100.js'), with each n.js a large file.
Comment 3•10 years ago
|
||
I pulled down some 2.X version of jquery. Would you mind attaching a zip/tarball/what-have-you of the complete test case? That way we can be sure that we are on the same page.
| Reporter | ||
Comment 4•10 years ago
|
||
Full test case attached, sorry I didn't do that in the first place. I'm using Browserify 3.46 to generate the bundle if that helps.
Comment 5•10 years ago
|
||
Thanks! Are you using file:// URIs or a local server?
| Reporter | ||
Comment 6•10 years ago
|
||
Local server (python -m SimpleHTTPServer for this testcase).
Comment 7•10 years ago
|
||
I'm seeing about 300ms of jank in Nightly 32 when I refresh the page so that the debugger gets the scripts that were GC'd. Obviously not ideal and we should reduce that as much as we can, but it's pretty far from the 30s of hanging reported.

Will try the other release channels soon, but which version of firefox are you reproducing this on?
| Reporter | ||
Comment 8•10 years ago
|
||
I'm seeing it in Aurora 31 (2014-05-08). I'll try it in Nightly tonight.
| Reporter | ||
Comment 9•10 years ago
|
||
How do I inspect the browser chrome and the page at the same time?
Comment 10•10 years ago
|
||
(In reply to mwrbrennan from comment #9)
> How do I inspect the browser chrome and the page at the same time?

Flip these settings on in the options panel: https://wiki.mozilla.org/images/5/5d/DevToolsDeveloperSettings.png

Restart the browser (I think; I forget if this is actually necessary).

Tools > Web Developer > Browser Toolbox; this opens a new window containing an instance of the devtools attached to the browser chrome. Then you can start a profile, switch back to the page and open the debugger in the content tools as you normally would.
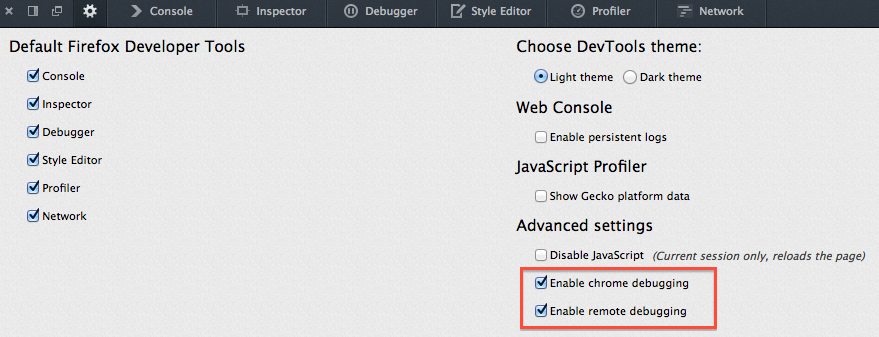
Comment 11•10 years ago
|
||
mwrbrennan, are you still testing this? Are you still seeing the behavior in the latest Aurora (or Nightly, if that's what you're using now?)
Flags: needinfo?(mwrbrennan)
| Reporter | ||
Comment 12•10 years ago
|
||
Hi Liz, sorry for the delay. I am seeing the behaviour in Aurora 32. I haven't yet had chance to profile it.
Flags: needinfo?(mwrbrennan)
| Reporter | ||
Comment 13•10 years ago
|
||
Attached a screenshot of the profile. Oddly, it seems to be spending most of its time doing XHR in my script, which seems... implausible? Some 17% is resolving source maps, which is highlighted.

Also of note is that Aurora gave me a Script Unresponsive dialog for my main.js, which again doesn't seem all that likely.
Updated•10 years ago
|
Blocks: dbg-sourcemap
Summary: Data URI sourcemap consisting of many largeish files hangs the debugger on page load → Large data URI sourcemaps can cause the debugger to hang
Comment 14•9 years ago
|
||
I just retested with the testcase from comment 4 and I'm not seeing any kind of stutter, hang, or jank. There have been some improvements to the performance of parsing source maps and they are also lazily parsed as well since the last time this bug had any activity.

I think those things took care of this.
Status: UNCONFIRMED → RESOLVED
Closed: 9 years ago
Resolution: --- → WORKSFORME
Updated•6 years ago
|
Product: Firefox → DevTools
You need to log in
before you can comment on or make changes to this bug.
Description
•