Network requests are delayed by 250ms on machines with high refresh rate monitors if an ad-blocker add-on is installed
Categories
(WebExtensions :: General, defect, P2)
Tracking
(firefox-esr78 affected, firefox84 affected, firefox85 affected, firefox86 affected)
People
(Reporter: orsonpeters, Unassigned)
References
Details
User Agent: Mozilla/5.0 (Windows NT 10.0; Win64; x64; rv:84.0) Gecko/20100101 Firefox/84.0
Steps to reproduce:
- Made a fresh profile.
- Refreshed https://doc.rust-lang.org/std/collections/hash_map/struct.VacantEntry.html without cache and documented the page load time.
- Installed any major ad-blocker extension. I have reproduced with uBlock Origin, AdBlock Plus and Adblocker Ultimate from the official extension website.
- Re-loaded the URL and documented page load time again.
- Repeated experiment many times to confirm difference is significant and correlated with having an ad-blocker installed and not due to random chance/unrelated variables.
- Repeated experiment with Firefox profiler turned on to gather profile information.
I can reproduce with Firefox 84.0.1 (64-bit) on Windows 10 Pro build 19041.685 (version 2004) with an AMD Threadripper 2950x.
Actual results:
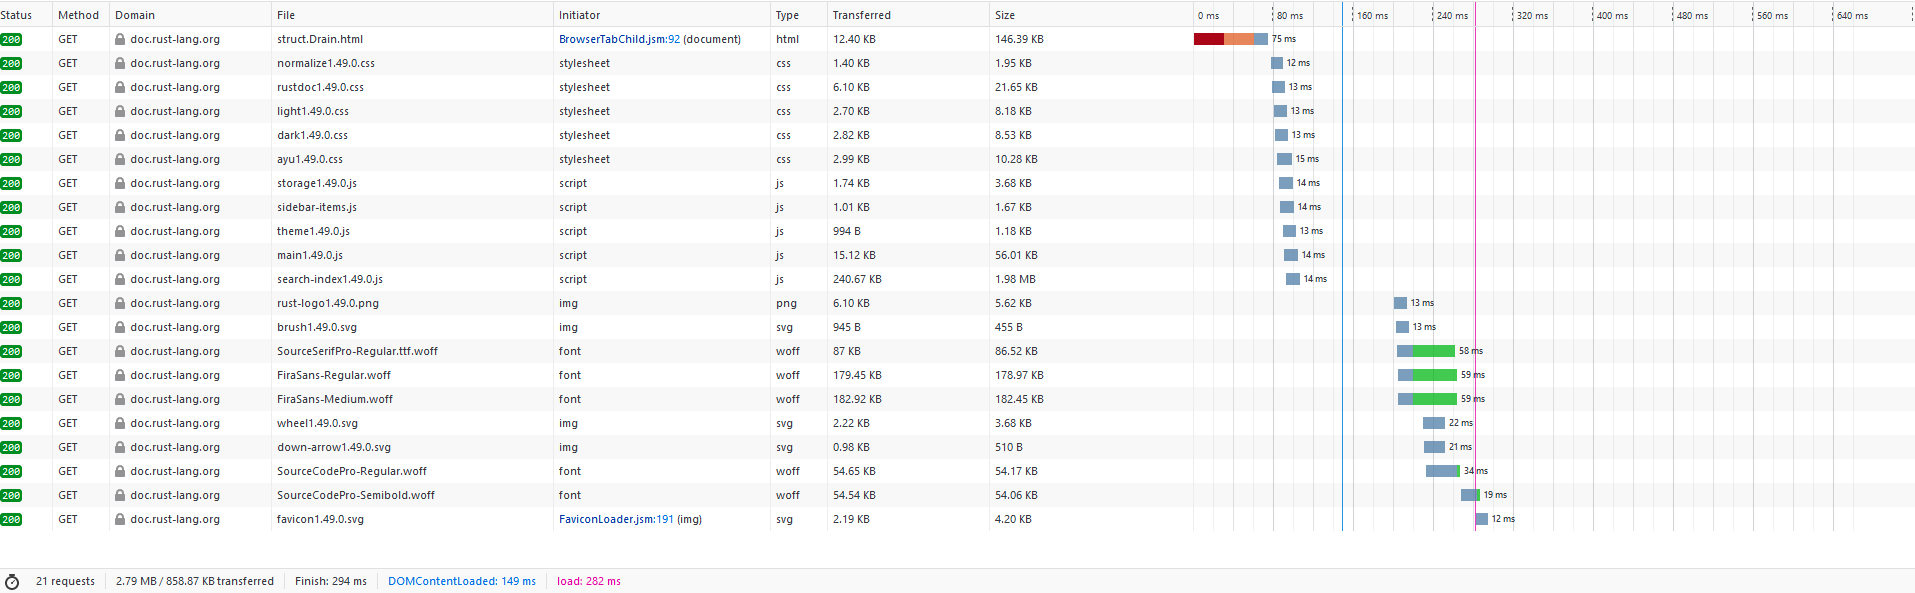
Page loading times without ad-blocker extension installed: https://user-images.githubusercontent.com/202547/103462655-ffc30900-4d26-11eb-86b3-8f14dcd5cc83.png
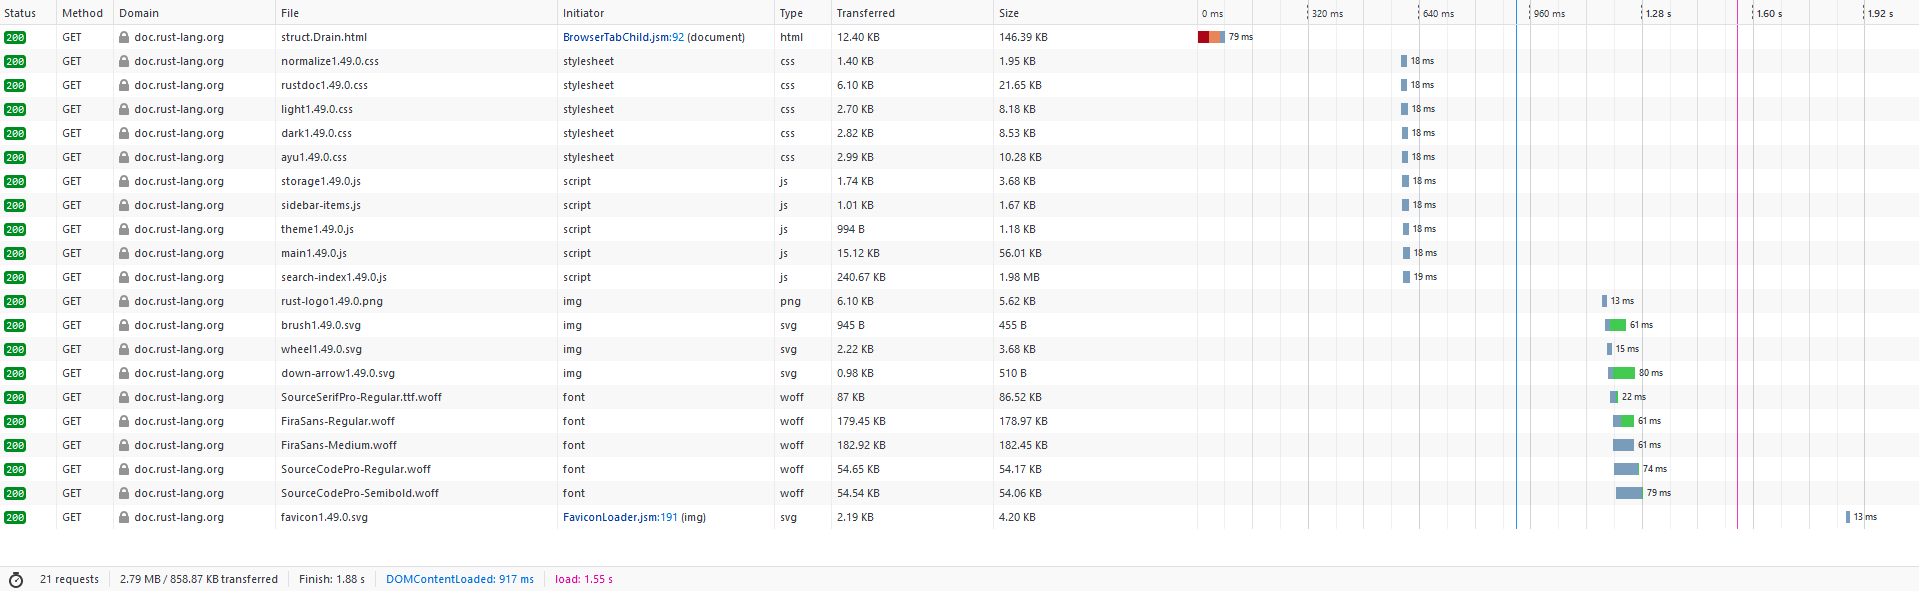
Page loading times with ad-blocker extension installed: https://user-images.githubusercontent.com/202547/103462720-8c6dc700-4d27-11eb-929a-8a5c812e695a.png
I noticed severe and consistent differences in page load time (~0.3 vs ~1.5 seconds). It did not matter whether the ad-blockers were actively filtering or had any filters enabled, the mere act of having them installed and enabled caused the issues.
The two performance profiles I recorded:
-
Without ad-blocker: https://share.firefox.dev/3hJu54w
-
With ad-blocker: https://share.firefox.dev/3hDXi0M
Very noticeable is the 'Network' tab, in which we can see that all of the delay is due to 'waiting for socket thread' and 'waiting to transmit the response'.
Expected results:
There should be much less of a performance impact for simply having an ad-blocker extension installed, especially when it is not actively filtering.
At first I believed this was a uBlock Origin bug, and I posted a bug report here: https://github.com/uBlockOrigin/uBlock-issues/issues/1430 . However they suggested I try other ad-blockers, and the issue persisted, indicating the issue is within Firefox itself.
In that thread https://bugzilla.mozilla.org/show_bug.cgi?id=1582990 was linked, which appears to be a very similar bug. However that bug got closed because the
issue was not reproducible by developers and the original reporter no longer replied.
Comment 1•5 years ago
|
||
I am confirming this bug based on the provided reports and a complete description of the issue.
I have chosen this component because there is where the issue's cause is most noticeable. If incorrect, please set a more appropriate component.
This issue appears to affect all the last versions of the main channels. An increase of 100-200ms or more is generally observed, although, leading times could show even more different values in the same scenarios (many cache-less refreshes have been done).
Considering the very random loading times, a regression range investigation could take a very long time. I have tested Nightly v65.0a1 (2018-10-22) (64-bit) and the results seem even worse.
Let me know if there is a faster way to do so or if it is necessary. NI me. Thank you.
Comment 2•5 years ago
|
||
If I am right, I think there is not much we can do about this bug.
When an ad-blocker is installed, all http requests are blocked for waiting the result (whether the request should be blocked or not) from the ad-blocker. I think this delay is not easy to mitigate, since the ad-blocker is actually running on another extension process.
Shane, what do you think? Do you have an idea about what we can do here?
Thanks.
| Reporter | ||
Comment 3•5 years ago
|
||
(In reply to Kershaw Chang [:kershaw] from comment #2)
If I am right, I think there is not much we can do about this bug.
When an ad-blocker is installed, all http requests are blocked for waiting the result (whether the request should be blocked or not) from the ad-blocker. I think this delay is not easy to mitigate, since the ad-blocker is actually running on another extension process.Shane, what do you think? Do you have an idea about what we can do here?
Thanks.
The delay I'm seeing is abnormal and doesn't affect every setup (e.g. my laptop can not reproduce). Therefore it is likely something is going actually wrong that can be fixed.
| Comment hidden (off-topic) |
| Comment hidden (off-topic) |
Comment 6•5 years ago
•
|
||
(In reply to Masatoshi Kimura [:emk] from comment #4)
Migrating to Manifest v3? (deprecate blocking webRequest and implement declarativeNetRequest)
A reminder that I could not reproduce reporter's issue, see https://github.com/uBlockOrigin/uBlock-issues/issues/1430#issuecomment-753508896. If you look closely at the profiling results, note that the "waiting for socket" is not caused by the extension.
Comment 7•5 years ago
|
||
Following the steps I could not reproduce either page load with addon enabled was 650ms and without was 634ms. This was a new profile, disabled cache, and Ubo as the only addon installed and enabled with the default filter lists.
| Comment hidden (off-topic) |
Comment 9•5 years ago
|
||
This is probably best for us to triage in our group.
Updated•5 years ago
|
| Comment hidden (off-topic) |
| Comment hidden (off-topic) |
Updated•4 years ago
|
Comment 12•4 years ago
|
||
I'd like to remind participants of this bug that the conversation needs to conform to the Community Participation Guideline. Specifically, the section on being respectful.
Comment 13•4 years ago
|
||
(In reply to Kershaw Chang [:kershaw] from comment #2)
If I am right, I think there is not much we can do about this bug.
When an ad-blocker is installed, all http requests are blocked for waiting the result (whether the request should be blocked or not) from the ad-blocker. I think this delay is not easy to mitigate, since the ad-blocker is actually running on another extension process.
The profile at https://share.firefox.dev/3hDXi0M shows no time spent in add-on code, and no indications that we are blocked on the add-on. We need to find out where the delay comes from. I'm moving this back to Network.
Orson, can you collect a network log and send it to me by email? https://developer.mozilla.org/en-US/docs/Mozilla/Debugging/HTTP_logging
Comment 14•4 years ago
|
||
(In reply to Markus Stange [:mstange] from comment #13)
and no indications that we are blocked on the add-on.
This was wrong; we are indeed blocked on "extension suspend". See these markers: https://share.firefox.dev/3jEa28v
Comment 15•4 years ago
•
|
||
Hi Markus,
webRequest events may be dispatched with a slight delay to avoid sending too many multiple small messages over IPC, the IdleDispatch is capped at 250ms and that seems suspiciously near to the 260ms that is explicitly mentioned in this bug and so I think it is likely the underlying reason for the behavior described in this issue (I'm adding Bug 1587058 as a see also, because it is an issue related to re-evaluate this "webRequest event coelescing").
Comment 16•4 years ago
|
||
Thanks for the pointer to that! I was about to ask "do we have a 250ms timeout anywhere", so this must be it.
Comment 17•4 years ago
|
||
I think this is turning out to be just a duplicate of bug 1560090. Orson, do you have a high refresh monitor? In the profile I can see us ticking at around 240Hz.
It seems that the frequent refresh ticks are causing idle events to never run. So, during a loading animation, all network requests are delayed until the 250ms timeout expires. This is quite terrible.
| Reporter | ||
Comment 18•4 years ago
|
||
(In reply to Markus Stange [:mstange] from comment #13)
(In reply to Kershaw Chang [:kershaw] from comment #2)
If I am right, I think there is not much we can do about this bug.
When an ad-blocker is installed, all http requests are blocked for waiting the result (whether the request should be blocked or not) from the ad-blocker. I think this delay is not easy to mitigate, since the ad-blocker is actually running on another extension process.The profile at https://share.firefox.dev/3hDXi0M shows no time spent in add-on code, and no indications that we are blocked on the add-on. We need to find out where the delay comes from. I'm moving this back to Network.
Orson, can you collect a network log and send it to me by email? https://developer.mozilla.org/en-US/docs/Mozilla/Debugging/HTTP_logging
I'll try to remember to do so tomorrow when I'm on my PC.
(In reply to Markus Stange [:mstange] from comment #17)
I think this is turning out to be just a duplicate of bug 1560090. Orson, do you have a high refresh monitor? In the profile I can see us ticking at around 240Hz.
It seems that the frequent refresh ticks are causing idle events to never run. So, during a loading animation, all network requests are delayed until the 250ms timeout expires. This is quite terrible.
I do in fact have a 240Hz monitor! I can also test tomorrow whether the delay is gone if I set it to 60Hz.
Comment 19•4 years ago
|
||
(In reply to orsonpeters from comment #18)
I'll try to remember to do so tomorrow when I'm on my PC.
Don't worry about this - I don't need the log anymore. I think we've got the cause nailed down. The profile was very helpful, thanks for bringing this to our attention.
I'm quite confident that switching to 60Hz will help, but do let us know how it works for you.
Updated•4 years ago
|
| Reporter | ||
Comment 20•4 years ago
|
||
(In reply to Markus Stange [:mstange] from comment #19)
(In reply to orsonpeters from comment #18)
I'll try to remember to do so tomorrow when I'm on my PC.
Don't worry about this - I don't need the log anymore. I think we've got the cause nailed down. The profile was very helpful, thanks for bringing this to our attention.
I'm quite confident that switching to 60Hz will help, but do let us know how it works for you.
Your confidence is not misplaced.
I can confirm that switching my monitor from 240Hz to 60Hz removes the delay from the network requests.
Comment 21•4 years ago
|
||
Great, thanks for checking!
Comment 22•4 years ago
|
||
Hi, we landed a change to the underlying code in bug 1587058, can you please re-test with current Nightly version 90?
| Reporter | ||
Comment 23•4 years ago
|
||
My test methodology: refresh 10 times using ctrl+F5 on the page https://doc.rust-lang.org/std/collections/hash_map/struct.VacantEntry.html, reporting the pink 'load: X ms' number at the bottom of the networking page. The first two reloads after changing a setup were discarded to reduce the effect of various kinds of caching effects.
Firefox stable version tested is 88.0.1, nightly is 90.0a1, my monitor was set to either 60Hz or 240Hz, and finally I either had no addons installed, or uBlock Origin installed but with filtering disabled.
The results: https://i.imgur.com/7FI5YSE.png
There are huge regressions across the board for load performance, that completely overshadow this bug. This is quite alarming and should be looked into further. It seems that since reporting this that on stable the performance of 60Hz + disabled adblock addon has also regressed to almost equal 240Hz + disabled adblock addon.
Updated•4 years ago
|
Comment 24•4 years ago
|
||
Thank you for the detailed testing Orson, it's very helpful!
It looks like this potentially uncovered a real regression (though unrelated to bug 1587058). Loading that Rust docs link went from about 400ms to about 700ms in my testing (after a few ignored runs, possibly while firefox downloads things in the background for the new profile).
Though measurements are pretty noisy (and I still want to double check this), but I narrowed it down using mozregressions to this pushlog:
https://hg.mozilla.org/integration/autoland/pushloghtml?fromchange=75a3ef057871c14e51e63136892ea56e0679ddc9&tochange=9c1aa135e1b5d11bfd1b53e71c45f22564e498c5
Of the patches linked there, only https://phabricator.services.mozilla.com/D106340 looks like it might impact performance (even some discussions in phabricator before landing), though from what I can notice, it might only be a regression with devtools open.
Dana or Alexandre, can you please check if that seems plausible? I don't understand devtools/certviewer enough to figure out easily on my own.
Comment 25•4 years ago
|
||
I wouldn't think that code would run without the devtools being open, but I could be wrong. Maybe an updated profile would help? (the ones in comment 0 are for 84)
Comment 26•4 years ago
|
||
https://hg.mozilla.org/integration/autoland/rev/2cf5cde0ea50b0dd5fbf507e509253e40be12f3c is a Jit change, that seems like a more likely culprit to me?
Comment 27•4 years ago
|
||
Could be, I only dismissed it because it looked like a webasm-only change to me.
Here's a profile after April 21: https://profiler.firefox.com/public/hqc6swa6sk3fjbbmpgsscfgczhx1nw50mtpspg8/
It looks like most of the samples in the parent process (and the main difference from previous Nightly) are in the certviewer js. We seem to be pegging the CPU during the load.
Comment 28•4 years ago
|
||
(In reply to Tomislav Jovanovic :zombie from comment #27)
Could be, I only dismissed it because it looked like a webasm-only change to me.
Here's a profile after April 21: https://profiler.firefox.com/public/hqc6swa6sk3fjbbmpgsscfgczhx1nw50mtpspg8/
It looks like most of the samples in the parent process (and the main difference from previous Nightly) are in the certviewer js. We seem to be pegging the CPU during the load.
Is that with the devtools open or not?
Comment 29•4 years ago
|
||
Yes sorry, devtools open in Nightly after April 21, fresh profile, no extensions.
I could post profiles from before, or after with devtools closed, but I didn't see any issues in those, or can't even find certviewer in samples.
Comment 30•4 years ago
•
|
||
If there's no issue with devtools closed, then isn't that all we wanted to confirm in this bug?
If there's a performance regression with devtools open, it should be tracked in a new bug.
Comment 31•4 years ago
|
||
Good call, filed bug 1712983.
Comment 32•4 years ago
|
||
https://i.imgur.com/E8Nftwk.png
It seems I got something similar but with far worse delay (a shocking 22 seconds).
However I didn't report it yet because I haven't find a stable way to reproduce it.
The delay just happens randomly
Comment 33•4 years ago
|
||
I got something similar but with far worse delay
Is this with Nightly? If so, probably related to bug 1717253.
Comment 35•4 years ago
•
|
||
Another user experiencing the issue described here has reported that the issue is no longer present in Firefox 90, see https://www.reddit.com/r/uBlockOrigin/comments/oh6gc0/issue_major_slow_down_in_firefox_windows_10_when/:
I can confirm myself that Firefox 90 fixes the issue I had.
Updated•2 years ago
|
Description
•