Closed
Bug 984537
Opened 11 years ago
Closed 11 years ago
Investigate keeping JIT code during GCs for compartments with on stack frames
Categories
(Core :: JavaScript Engine: JIT, defect)
Tracking
()
RESOLVED
FIXED
mozilla32
People
(Reporter: bhackett1024, Assigned: bhackett1024)
References
Details
(Whiteboard: [talos_regression])
Attachments
(2 files)
|
4.04 KB,
patch
|
jandem
:
review+
|
Details | Diff | Splinter Review |
|
2.86 KB,
patch
|
jandem
:
review+
|
Details | Diff | Splinter Review |
Since bug 932982 we can preserve jitcode during GCs as often as we want without entraining heap data that can never be collected. It might be worth doing this more often --- preserving code for compartments with frames on the stack (as with the attached patch) improves my score on octane-deltablue about 4000 points. Trying this across all of octane, however, seems to be a wash, with the improvement on deltablue offset by smaller regressions on raytrace, splay and splay-latency. Preserving jitcode does incur a cost during GC of tracing the Ion/Baseline scripts and some extra type information to copy at the end, but seeing such regressions when the involved benchmarks have so little code seems strange and it would be good to figure out what's going on.
Comment 1•11 years ago
|
||
(In reply to Brian Hackett (:bhackett) from comment #0)
> Trying this across all of octane, however, seems to be a
> wash, with the improvement on deltablue offset by smaller regressions on
> raytrace, splay and splay-latency.
This was not expected :0. Raytrace should have been an improvement actually! The measurements are done on non-ggc right?
Comment 2•11 years ago
|
||
Btw. did you see bug 983477? That does the same for Parallel IonScripts. Maybe good to to coordinate, because maybe we can use the same algorithms for both?
Comment 3•11 years ago
|
||
(In reply to Hannes Verschore [:h4writer] from comment #2)
> Btw. did you see bug 983477? That does the same for Parallel IonScripts.
> Maybe good to to coordinate, because maybe we can use the same algorithms
> for both?
The metric we used there (as suggested by terrence, as inspired by Chunk eviction in the GC) is a decent, general heuristic: count how many major collections a JIT script is idle (its "age"), and evict when reaching some maximum.
The perf hit involves resetting the age to 0 when a script has activity. For PJS this is simple: there's a clear cut entry point in calling ForkJoin. We reset the entry script's age to 0 every time it goes through ForkJoin. PJS also already records all possible functions that an IonScript might call, and we can piggyback on the marking of the entry IonScript to propagate the age to all possible callees.
ISTM the challenge with sequential IonScripts is that there's no clear cut entry point.
Comment 4•11 years ago
|
||
@Brian: I don't know what you actually were looking at, but this looks very promising for me! It shows mostly the numbers I was expecting. So I wouldn't mind landing this as is (didn't look at the code yet). But performance wise this looks good on 32bit:
Before:
Richards: 28598
DeltaBlue: 30315
Crypto: 26439
RayTrace: 32453
EarleyBoyer: 29074
RegExp: 2608
Splay: 19768
SplayLatency: 15307
NavierStokes: 29235
PdfJS: 15682
Mandreel: 25771
MandreelLatency: 27242
Gameboy: 45763
CodeLoad: 17645
Box2D: 31736
zlib: 50268
Typescript: 17348
----
Score (version 9): 22813
After:
Richards: 26416
DeltaBlue: 36338
Crypto: 26697
RayTrace: 40847
EarleyBoyer: 35319
RegExp: 2593
Splay: 21106
SplayLatency: 14502
NavierStokes: 28909
PdfJS: 17374
Mandreel: 25197
MandreelLatency: 25565
Gameboy: 41522
CodeLoad: 16985
Box2D: 34086
zlib: 50995
Typescript: 17115
----
Score (version 9): 23471
Flags: needinfo?(bhackett1024)
| Assignee | ||
Comment 5•11 years ago
|
||
(In reply to Shu-yu Guo [:shu] from comment #3)
> The metric we used there (as suggested by terrence, as inspired by Chunk
> eviction in the GC) is a decent, general heuristic: count how many major
> collections a JIT script is idle (its "age"), and evict when reaching some
> maximum.
>
> The perf hit involves resetting the age to 0 when a script has activity. For
> PJS this is simple: there's a clear cut entry point in calling ForkJoin. We
> reset the entry script's age to 0 every time it goes through ForkJoin. PJS
> also already records all possible functions that an IonScript might call,
> and we can piggyback on the marking of the entry IonScript to propagate the
> age to all possible callees.
>
> ISTM the challenge with sequential IonScripts is that there's no clear cut
> entry point.
This seems like engineering overkill to me. For PJS, why not just always keep jitcode around, except during shrinking GCs? For sequential JS, I think it's still important to try to discard jitcode early, so an approach combining our existing animation based heuristics with minor spot fixes / extensions like this seems reasonable.
| Assignee | ||
Comment 6•11 years ago
|
||
Comment on attachment 8392389 [details] [diff] [review]
patch
OK, I don't know why we're seeing discrepancies in behavior here, but since this should improve things and it does improve things for Hannes, putting this up for review.
Attachment #8392389 -
Flags: review?(jdemooij)
Flags: needinfo?(bhackett1024)
Comment 7•11 years ago
|
||
Comment on attachment 8392389 [details] [diff] [review]
patch
Review of attachment 8392389 [details] [diff] [review]:
-----------------------------------------------------------------
Nice, r=me with comments below addressed.
::: js/src/jit/IonFrames.cpp
@@ +936,5 @@
> }
> #endif
>
> +static JSCompartment *
> +IonJSFrameCompartment(const IonFrameIterator &frame)
You can remove this function.
@@ +1197,5 @@
>
> void
> MarkJitActivations(JSRuntime *rt, JSTracer *trc)
> {
> + for (JitActivationIterator activations(rt); !activations.done(); ++activations) {
Nit: no {}
@@ +1205,5 @@
> +
> +JSCompartment *
> +TopmostJitActivationCompartment(JSRuntime *rt)
> +{
> + for (JitActivationIterator activations(rt); !activations.done(); ++activations) {
Just |return activations.activation()->compartment();| here and drop the braces.
Attachment #8392389 -
Flags: review?(jdemooij) → review+
Comment 8•11 years ago
|
||
Note: I didn't test with ggc yet and due to the nature of ggc it will require less recompiling. So this would gain us less. But since needing to recompile is a bad thing, I think we still need this!
Comment 9•11 years ago
|
||
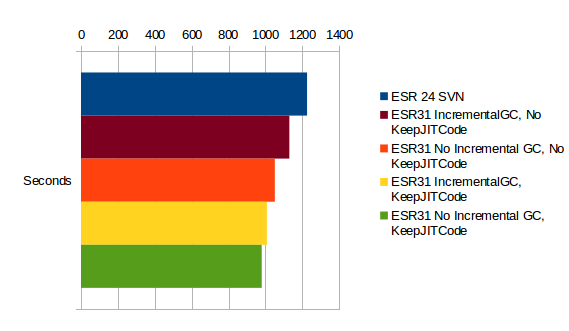
I've figured out that it makes quite a difference to keep JIT code for 0 A.D. (the RTS game).
We have a set of scripts we use during the whole game which in average takes maybe half an hour.
For us it would be interesting to keep JIT code even if it takes a while until it gets executed again.
I've tested with our non-visual replay mode and measured how many seconds it takes to run a replay (which does all the simulation and AI calculations). In normal games it would take longer until the JIT code gets used again, so I'm not completely sure it will be the same situation.
There's some variantion between the measurements but the performance of this patch seems to be roughly in the middle between the unmodified version and the version using gcPreserveCode from the testing functions. We are not using GGC yet and I've disabled incremental GC because it currently has a bug (991820) which could affect these measurements.
this patch measurement 1: 1021 s
this patch measurement 2: 1014 s
with gcPreserveCode, without this patch: 980 s
no gcPreserveCode, without this patch: 1051 s
Is there a way do get closer to the performance of the gcPreserveCode version?
Comment 10•11 years ago
|
||
Brian what's the status of this bug? It'd be great if we could get this in FF 31.
The jit-test timeouts on Try looked a lot like bug 998997.
Assignee: nobody → bhackett1024
Flags: needinfo?(bhackett1024)
| Assignee | ||
Comment 11•11 years ago
|
||
(In reply to Jan de Mooij [:jandem] from comment #10)
> Brian what's the status of this bug? It'd be great if we could get this in
> FF 31.
>
> The jit-test timeouts on Try looked a lot like bug 998997.
Yeah, they do. I'll run this again through try when that bug lands.
Depends on: 998997
Flags: needinfo?(bhackett1024)
| Assignee | ||
Comment 12•11 years ago
|
||
OK, retesting after bug 998997, the timeouts this patch was causing seem to be gone.
https://hg.mozilla.org/integration/mozilla-inbound/rev/483210d830f0
Try: https://tbpl.mozilla.org/?tree=Try&rev=c4a3cda1f952
Comment 13•11 years ago
|
||
Status: NEW → RESOLVED
Closed: 11 years ago
Resolution: --- → FIXED
Target Milestone: --- → mozilla31
Comment 14•11 years ago
|
||
Is it possible that this is the cause for the ~10M regression on AWSY (other->js) ?
Comment 15•11 years ago
|
||
This definitely looks like it caused a big memory regression: bug 1003468 comment 1. Given that the speed benefits on Octane were only moderate, I suggest this patch be backed out for now. bhackett, does that sound reasonable to you?
Flags: needinfo?(bhackett1024)
| Assignee | ||
Comment 16•11 years ago
|
||
Sure. I didn't see any talos email about memory regressions though; why was this only seen by AWSY? It leaves me in kind of a bind to investigate possible fixes. The idea behind this patch was that during the normal course of browsing we should only be triggering GCs from the event loop and not via the operation callback or forcing them on allocation. Maybe that assumption is wrong.
Flags: needinfo?(bhackett1024)
Comment 17•11 years ago
|
||
Talos is crap at detecting memory regressions, unfortunately.
The good news is that you can trigger AWSY runs with try pushes:
https://areweslimyet.com/faq.htm#how-can-i-request-additional-awsy-tests-on-specific-changesets-or-try-pushes
Comment 18•11 years ago
|
||
It was not a huge win but pretty noticeable on Octane-pdfjs and deltablue, and releasing JIT code on every GC can hurt games. Maybe we should keep JIT code only for content zones: chrome scripts are more likely to be short-running, probably won't benefit as much and there's a ton of different compartments in the system zone. Thoughts?
Comment 19•11 years ago
|
||
My suggestion is to back it out and investigate why "unused" went up by more than 13x, and why it accounts for 90% of the code size. ("unused" was 78% before the change, but the total was small enough that this didn't matter so much.) Hopefully there are some big wins to be had there by being a bit smarter.
As for chrome vs. content: the AWSY measurements are taken after opening 100 sites in 30 tabs, so I would expect the code to be dominated by content, and treating chrome differently is unlikely to make a difference.
Comment 20•11 years ago
|
||
(In reply to Nicholas Nethercote [:njn] from comment #19)
> My suggestion is to back it out and investigate why "unused" went up by more
> than 13x, and why it accounts for 90% of the code size. ("unused" was 78%
> before the change, but the total was small enough that this didn't matter so
> much.)
OK, yeah I agree we should back it out for now.
> Hopefully there are some big wins to be had there by being a bit
> smarter.
I wonder if the ExecutableAllocator for non-Ion code should be per-Zone instead of per-runtime to avoid fragmentation and get better memory reporting. We should try that.
> As for chrome vs. content: the AWSY measurements are taken after opening 100
> sites in 30 tabs, so I would expect the code to be dominated by content, and
> treating chrome differently is unlikely to make a difference.
Oh right, somehow I thought this was after starting the browser..
Comment 21•11 years ago
|
||
On a related note, some of the people working on Tarako were recently wondering whether disabling the JITs would be a good idea, in order to save memory. And I said "heavens, don't do that; the memory used is small and the performance win is enormous". Please don't make a liar of me! :)
Comment 22•11 years ago
|
||
I just tried this locally and I'm also seeing a pretty large amount of unused code memory, even after pressing the GC/CC/minimize memory buttons (a lot of it goes away with that but not everything). I'll try to find out what's keeping each of these pools alive.
Comment 23•11 years ago
|
||
Just a theory, but I could imagine that this patch would increase peak memory usage, and this just may be exacerbating an existing issue where memory isn't being released. Even with the releasing of unused memory fixed, we may want to keep an eye out for the effect of increasing peak memory usage on B2G, which so often hovers between life and death.
Comment 24•11 years ago
|
||
> OK, yeah I agree we should back it out for now.
bhackett, can you back it out, please?
Status: RESOLVED → REOPENED
Flags: needinfo?(bhackett1024)
Resolution: FIXED → ---
| Assignee | ||
Comment 25•11 years ago
|
||
Flags: needinfo?(bhackett1024)
Comment 26•11 years ago
|
||
This also needs backout from Aurora, so if you put up an aurora approval request, RyanVM can probably do that once it is approved.
| Assignee | ||
Comment 27•11 years ago
|
||
Comment on attachment 8392389 [details] [diff] [review]
patch
Requesting approval for backout of this bug, as it caused some memory regressions on AWSY.
Attachment #8392389 -
Flags: approval-mozilla-aurora?
Comment 28•11 years ago
|
||
We usually don't bother with approval requests on backouts.
https://hg.mozilla.org/releases/mozilla-aurora/rev/a7676d7a44ac
Target Milestone: mozilla31 → ---
Updated•11 years ago
|
Attachment #8392389 -
Flags: approval-mozilla-aurora?
Comment 29•11 years ago
|
||
Thanks Brian and Ryan!
| Assignee | ||
Comment 30•11 years ago
|
||
Hmm, running tp5 locally and on tinderbox I don't really see how this patch would affect memory usage. This is a pretty simple patch that just preserves JIT code when the associated compartment is active on the stack at the time of the GC, and we don't seem to be triggering such GCs during tp5 (which is what I thought would be the case, since we should normally be triggering GCs from the event loop when there isn't any long running JS). e.g. see the tp5 logs in https://tbpl.mozilla.org/?tree=Try&rev=bbfcfff0d703 which adds some spew to this patch.
Where are the scripts and so forth needed to run the AWSY harness locally?
Comment 31•11 years ago
|
||
I think the scripts are here: https://github.com/Nephyrin/MozAreWeSlimYet
Comment 32•11 years ago
|
||
AWSY has dropped back down since the backout -- look at the green line in the "Miscellaneous Measurements" graph (you'll have to zoom in a few times to see it).
The push that triggered the drop is https://hg.mozilla.org/integration/mozilla-inbound/pushloghtml?fromchange=81587bb1f916&tochange=d5fa6dfc398b, and it includes this backout. So it's pretty clear this patch is the cause... there must be something else going on.
Comment 33•11 years ago
|
||
Oh, here's a more precise range, with only three patches, including the backout: https://hg.mozilla.org/integration/mozilla-inbound/pushloghtml?fromchange=5e05477283b3&tochange=767f7423863b
Comment 34•11 years ago
|
||
backing this out has a ~2.3% regression on v8 for linux32 and linux64. We had a win a few days earlier, I assume the relanding of this will see an improvement :)
Whiteboard: [talos_regression]
Comment 35•11 years ago
|
||
And as I said on bug 996813, this was a huge win on Octane-Typescript on my average Joe win7 machine and on FFOS on AWFY.
Comment 36•11 years ago
|
||
(In reply to Joel Maher (:jmaher) from comment #34)
> backing this out has a ~2.3% regression on v8 for linux32 and linux64. We
> had a win a few days earlier, I assume the relanding of this will see an
> improvement :)
Do you really mark backouts with [talos_regression]? That seems wrong. What if somebody landed a patch that caused correctness issues and then backed it out, would you do the same in that case?
| Assignee | ||
Comment 37•11 years ago
|
||
This patch only looks for Ion frames on the stack. It seems to do better on AWSY (https://areweslimyet.com/?series=bhackett, e.g. compare 415 MB After-TP5 vs. ~425 MB typically without this patch) and also hits most of the time during GCs on octane, including all the GCs during deltablue and pdfjs.
Attachment #8418512 -
Flags: review?(jdemooij)
Comment 38•11 years ago
|
||
:njn, thinking on this it doesn't seem as though marking a bug as [talos_regression] makes sense, but it also doesn't make sense to file a new bug as a talos regression when we backout a patch that is an improvement. Maybe a new bug is better than editing the current bug in this situation. My goal is just to annotate all the regressions we see.
Comment 39•11 years ago
|
||
Comment on attachment 8418512 [details] [diff] [review]
only look for ion frames
Review of attachment 8418512 [details] [diff] [review]:
-----------------------------------------------------------------
OK, this is a reasonable middle ground.
Attachment #8418512 -
Flags: review?(jdemooij) → review+
| Assignee | ||
Comment 40•11 years ago
|
||
Status: REOPENED → RESOLVED
Closed: 11 years ago → 11 years ago
Resolution: --- → FIXED
Target Milestone: --- → mozilla32
Comment 43•11 years ago
|
||
(In reply to Joel Maher (:jmaher) from comment #42)
> are we going to reland this on aurora?
Given this caused a significant memory regression on Aurora (~14% in our Mozmill Endurance tests), I'd like to request we hold off uplift. I'd like to be able to check the patch on mozilla-central hasn't re-regress these tests.
Comment 44•11 years ago
|
||
ok, I will followup in a few business days to see the status.
| Assignee | ||
Comment 45•11 years ago
|
||
Yeah, since this is just a performance thing anyways I don't see why we would uplift rather than just let it ride the trains as usual.
Flags: needinfo?(bhackett1024)
Comment 46•11 years ago
|
||
(In reply to Brian Hackett (:bhackett) from comment #45)
> Yeah, since this is just a performance thing anyways I don't see why we
> would uplift rather than just let it ride the trains as usual.
I was thinking the same thing.
Comment 47•11 years ago
|
||
I know Yves was hoping to get this in the next standalone SM release for his work on 0 A.D. I don't know if the patch that landed here will bring the performance improvement that he was hoping for though. Yves, could you chime in?
Flags: needinfo?(yves.gwerder)
Comment 48•11 years ago
|
||
I've made this measurement for 0 A.D. a few weeks ago.
http://www.wildfiregames.com/forum/uploads//monthly_04_2014/post-7202-0-53293200-1396707010.png
Some more information about it is available here: http://www.wildfiregames.com/forum/index.php?showtopic=18466
As you can see, there are two issues that make quite a performance difference for us.
One is a bug with incremental GC (bug 991820) and the other one is caused by garbage collection of JIT code. I have tested the first version of this patch and it improved the JIT GC problem, although not as much as just disabling it completely (which is a hack obviously and just for testing).
I haven't tested the latest version of this patch yet and can't say how much it improves the JIT GC problem. I'm quite busy at the moment, but if it makes a difference for decision making, I could probably test again (would have to integrate the latest API changes first). Having the performance problem with JIT GC solved in ESR31 would be very nice.
Flags: needinfo?(yves.gwerder)
Comment 49•11 years ago
|
||
:ashughes, have the mozmill tests ran? I would like to know if this fixes the problem you were seeing.
Flags: needinfo?(anthony.s.hughes)
Comment 50•11 years ago
|
||
(In reply to Joel Maher (:jmaher) from comment #49)
> :ashughes, have the mozmill tests ran? I would like to know if this fixes
> the problem you were seeing.
Mihaela is taking care of this. I'll let her comment as to the status.
Flags: needinfo?(anthony.s.hughes) → needinfo?(mihaela.velimiroviciu)
Comment 51•11 years ago
|
||
Both Nightly (32.0a1) and Aurora (31.0a2) endurance results show memory decrease starting May the 6th:
* Aurora: http://mozmill-daily.blargon7.com/#/endurance/charts?app=All&branch=31.0&platform=All&from=2014-04-20&to=2014-05-14
* Nightly: http://mozmill-daily.blargon7.com/#/endurance/charts?app=All&branch=32.0&platform=All&from=2014-04-01&to=2014-05-14
There are no significant memory increases after that.
Flags: needinfo?(mihaela.velimiroviciu)
Comment 52•11 years ago
|
||
Can we uplift this to Aurora then?
Comment 53•11 years ago
|
||
Anthony, are you ok with the uplift to aurora? Thanks
Comment 54•11 years ago
|
||
(In reply to Sylvestre Ledru [:sylvestre] from comment #53)
> Anthony, are you ok with the uplift to aurora? Thanks
Yes, go ahead. I checked the reports and we've actually improved by 1MB on average compared to before this regression was introduced.
Flags: needinfo?(anthony.s.hughes)
Comment 55•11 years ago
|
||
Brian, could you fill the uplift request?
Anthony: Thanks!
Flags: needinfo?(bhackett1024)
| Assignee | ||
Comment 56•11 years ago
|
||
(In reply to Sylvestre Ledru [:sylvestre] from comment #55)
> Brian, could you fill the uplift request?
>
> Anthony: Thanks!
Per comments 45 and 46 I still don't know why this should get uplifted, it's a performance improvement and not a bugfix and historically I don't think I can remember any similar bugs getting uplifted.
Flags: needinfo?(bhackett1024)
Comment 57•11 years ago
|
||
(In reply to Brian Hackett (:bhackett) from comment #56)
> I still don't know why this should get uplifted, it's a performance improvement and not a bugfix
Is it, or are we fixing a performance regression?
I agree that straight up performance improvements should just ride the trains, but if we're rectifying previously introduced performance degradation it should be uplifted (assuming it's safe to do so).
Comment 58•11 years ago
|
||
> Is it, or are we fixing a performance regression?
The backout caused a "performance regression" because it removed an improvement, but otherwise is not fixing a regression.
You need to log in
before you can comment on or make changes to this bug.
Description
•